728x90

schema.cds
entity ChartDataEntities

entity ChartDataEntities : cuid {
    parent                      : Association to one RootEntities;
    criticality                 : Association to one Criticality;
    integerValue                : Integer;
    integerValueWithUoM         : Integer;
    uom                         : UnitOfMeasure;
    forecastValue               : Integer;
    targetValue                 : Integer default 30;
    dimensions                  : Integer;

    areaChartToleranceUpperBoundValue   : Integer default 90;
    areaChartToleranceLowerBoundValue   : Integer default 80;
    areaChartDeviationUpperBoundValue   : Integer default 50;
    areaChartDeviationLowerBoundValue   : Integer default 0;
}
ChartDataEntities는 RootEntities를 부모로 두는 의미의 일대일 관계를 갖도록 parent라는 객체를 통해 연결시켜 준다.
뿐만 아니라, Chart로 보여줄 속성인 criticality부터 dimensions까지 설정 값을 선언해 준다.
객체 uom은 common.cds에 정의되어 있는 entity sap.common.UnitOfMeasure을 가리킨다.
도한 sap.common.UnitOfMeasure은 sap.common.UnitOfMeasureCodeList가 참조하고 있는 CodeList를 기반으로
code를 킷값을 둠으로서 uom 값이 결정된다고 보면 된다.
다시 말해 sap.common.CodeList의 code 값을 계속해서 재사용함으로써 정규화를 시키는 데에 의의를 두는 것이다.
areaChartTolerance는 허용 오차를, areaChartDeviation은 편차에 관한 값을 정의한다.

//Calculate Chart Criticality Values
//Only calculate, if the chartEntities (source) is part of the request and is not empty (would be useless to calculate)
if(response.hasOwnProperty('chartEntities') && response.chartEntities.length > 0) {
    //If the forecast or target Value is not given, they should be requested and when the request is empty they should be generated
    //Both value are needed to fill in the values needed for the criticality calculation
    if(!response.chartEntities[0].hasOwnProperty('forecastValue') || !response.chartEntities[0].hasOwnProperty('targetValue')) {
        //Requesting all chart entities and create a map, where the chart entity Id is key and an object containing target and forecast value is the value
        const chartEntities =  new Map((await SELECT.from(ChartDataEntities, item => {
            item.ID, item.forecastValue, item.targetValue
        }).where({parent_ID : response.ID})).map(key => [key.ID, { forecastValue: key.forecastValue, targetValue: key.targetValue }]));
        //Calculating the forcast and target Value of each chart entity
        response.chartEntities.forEach(async e => {
            e.forecastValue = (chartEntities.get(e.ID) != undefined) ? chartEntities.get(e.ID).forecastValue : e.integerValue + 10;
            e.targetValue = (chartEntities.get(e.ID) != undefined) ? chartEntities.get(e.ID).targetValue : e.integerValue + 20;
        })
    }
chartEntities 속성 값이 있는지 여부를 hasOwnProperty() 메서드를 사용해 확인하고,
chartEntities가 가지고 있는 데이터 값의 배열 길이가 0보다 클 때를 가정한다.
뿐만 아니라, chartEntities의 첫 번째 행 값 중에서 forecastValue 값을 확인했는데 없거나,
targetValue 값이 없다고 판단된다면의 가정 상황 속에서
새로운 변수 chartEntities라는 이름의 새로운 Map 객체를 생성한다.
이 객체는 데이터베이스에서 가져온 chartDataEntities 테이블의 값을 담게 된다.
데이터베이스에서 parent_ID가 response.ID와 일치하는 항목들을 선택하고,
item.ID, item.forecastValue, item.targetValue 값을 매핑해 chartEntities에 저장한다.
response.chartEntities 배열을 순회하면서 각 요소를 처리하며,
forecastValue에서는 해당 요소의 ID를 키로 사용하여 chartEntities에 값을 가져온다.
만약 값이 정의되어 있다면 chartEntities.get(e.ID).forecastValue 값을 사용하고,
그렇지 않다면 e.integerValue + 10을 사용한다.
또한 targetValue는 위와 같이, 값이 정의되어 있다면 chartEntities.get(e.ID).targetValue 값을 사용하고,
그렇지 않다면 e.integerValue + 20을 사용한다.
참고로 forEach() 메서드는 async 비동기 함수의 실행을 기다려주지 않으므로,
async를 적어줘도 의미가 없기 때문에 제거해주는 것이 좋다.

response.chartEntities.forEach(e => {
    e.areaChartToleranceUpperBoundValue = e.integerValue + Math.round((e.integerValue / e.targetValue) *5 + 15);
    e.areaChartToleranceLowerBoundValue = e.integerValue - Math.round((e.integerValue / e.targetValue) *5 + 15);
    e.areaChartDeviationUpperBoundValue = e.forecastValue + Math.round((e.integerValue / e.forecastValue) *10 + 30);
    e.areaChartDeviationLowerBoundValue = e.forecastValue - Math.round((e.integerValue / e.forecastValue) *10 + 30);
});
이제 두 번째 if문을 빠져나와서 response.chartEntities 배열을 다시 순회하면서 각 요소의 추가 속성을 계산한다.
areaChartToleranceUpperBoundValue는
e.integerValue에 (e.integerValue / e.targetValue) * 5 + 15를 반올림해 더한 값이다.
areaChartToleranceLowerBoundValue는
e.integerValue에서 (e.integerValue / e.targetValue) * 5 + 15를 반올림해 뺀 값이다.
areaChartDeviationUpperBoundValue는
e.forecastValue에서 (e.integerValue / e.forecastValue) * 10 + 30을 반올림해 더한 값이다.
areaChartDeviationLowerBoundValue는
e.forecastValue에서 (e.integerValue / e,forecastValue) * 10 + 30을 반올림해 뺀 값이다.
layouts_RootEntities.cds
#fieldWithPrice
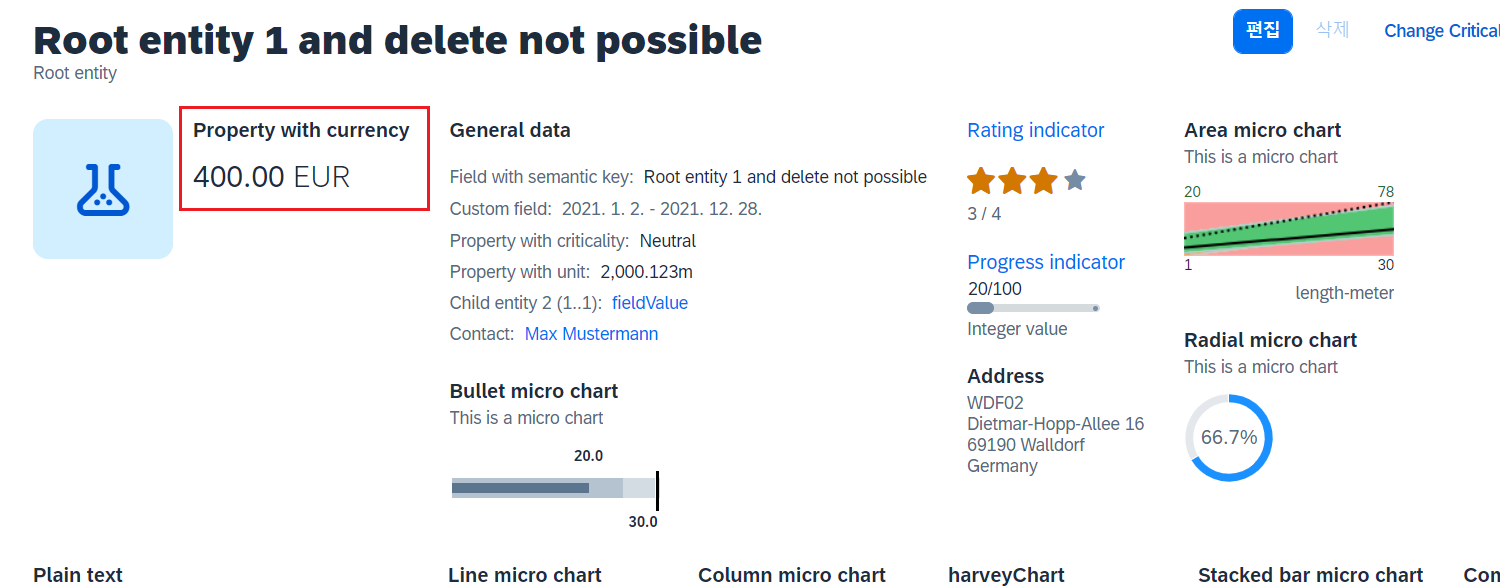

@UI.DataPoint는 숫자 값 혹은 텍스트로 표현되는 상태 값을 시각화 하는 데에 사용된다.
fieldWithPrice는 해당 오브젝트의 금액에 대한 정보를 불러온다.
#HeaderData

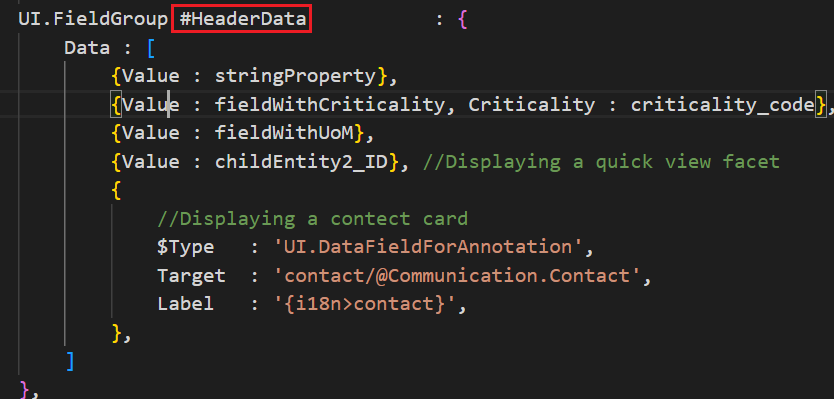
stringProperty는 저장시켜 놓은 Root Entity의 명칭을 의미한다.
fieldWithCriticality는 각 code 값과 일치할 때 0은 Neutral, 1은 Negative 등과 같이 해당 텍스트로 대체된다.
criticality_code는 각 sap에서 제공하는 Criticality와 상응하는 이모티콘과 색상으로 표현된다.
fieldWithUoM은 저장돼 있는 데이터의 측정 값을 보여준다.
childEntity2_ID는
UI.DataFieldForAnnotation을 사용하면 어노테이션을 참조할 수 있게 된다.
Target에서 객체 contact에 관해 정의해 놓았던 layouts_contacts.cds의 @Communication.Contact를 호출한다.
#bulletChart

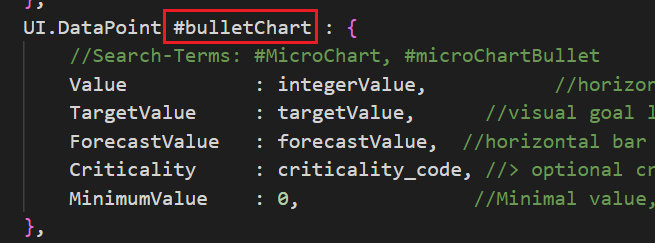
Chart에 쓰이는 DataPoint의 값들에 대해 정의한다.
Value 값인 integerValue는 측정값을 의미한다.
TargetValue의 targetValue는 UI 상으로 목푯값을 보여준다.
ForecastValue의 forecastValue는 예측값에 대해 투명한 수평바 형태로 표현된다.
Criticality에서는 code에 따른 색상의 변화를 보여준다.
MinimumValue는 최솟값이 0임을 명시해준다.

ChartType은 #Bullet으로 지정한다.
Bullet Chart는 하나의 측정값을 하나 이상의 다른 측정값(TargeValue)과 비교할 수 있게 해준다.
Dimensions에는 dimension 속성을 참조하도록 한다.
Measures에는 integerValue 속성을 참조하도록 한다.
MeasureAttributes에서는 Measures에서 참조하는 integerValue의 실제 값에 대해 정의한다.
이는 데이터 속성 값을 정의해 두었던 @UI.DataPoint#bulletChart를 DataPoint에서 호출한다.
Measure에는 참조하고 있는 속성인 integerValue의 실제 값이 나타나도록 integerValue 값으로 지정한다.
Role에 #Axis1으로 설정하면 모든 측정값은 실제 값을 나타내는 단색 열로 표시된다.
참고로 #Axis2로 설정하게 되면 검은색 실선으로 표시된다.
#ratingIndicator


@UI.DataPoint에서 ratingIndicator에 관한 값에 대해 정의한다.
Value에 starsValue 값으로 지정해준다.
TargetValue에는 최대 별의 개수를 4개로 설정한다.
Visualization에는 #Rating으로 설정하여 별 점수로 표현되도록 한다.
![@Common.QuickInfo]는 마우스 커서를 해당 UI에 두었을 때 원하는 텍스트를 노출시킬 수 있도록하는 기능을 한다.
#progressIndicator
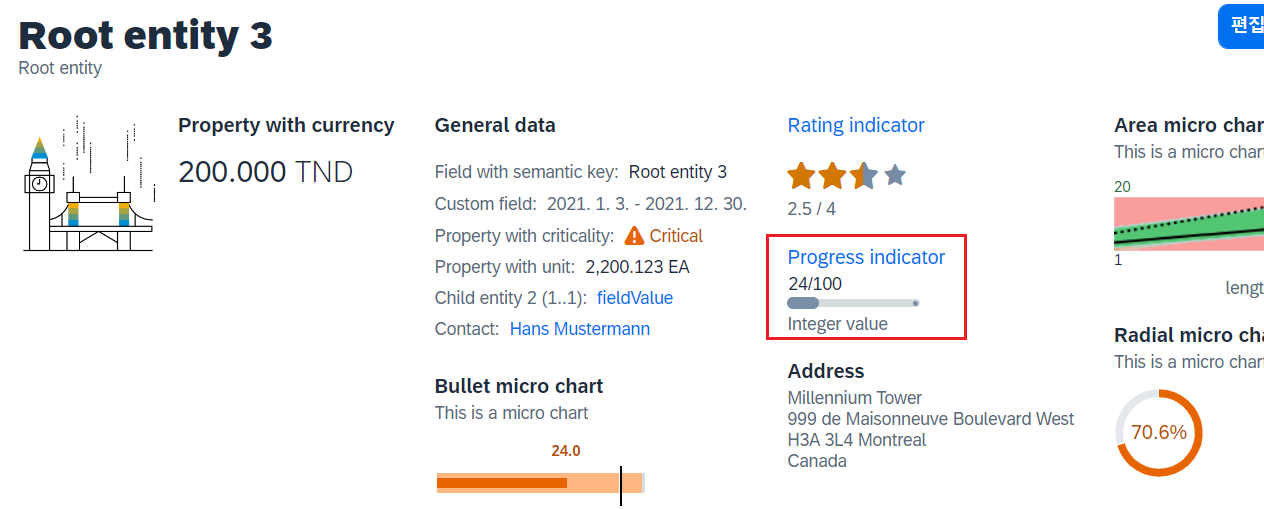

Value에는 실제 진행률인 integerValue로 정의한다.
TargetValue에는 최대 진행률인 목푯값을 100으로 설정하고,
Visualization은 진행률을 보여주는 #Progress로 지정한다.
#areaChart

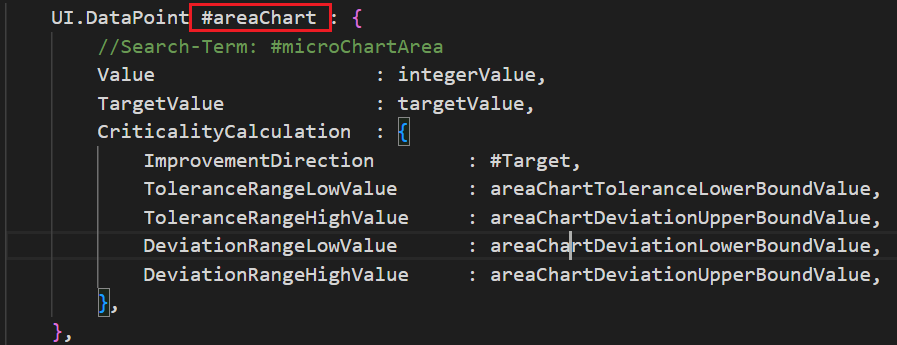
Area Micro Chart는 실제 측정값과 목푯값 사이의 추세(trend)를 보여주는 차트이다.
여기서 차트 하단은 dimensions의 경곗값이고, 차트 상단은 measure attributes의 경곗값이다.
CriticalityCalculation에서는 차트에 그려질 임곗값(오류, 경고, 허용 및 양호) 범위와 함께 그려질 수 있도록
service.js에서 정의해두었던 계산식의 값인 네 가지 값을 호출한다.
ImprovementDirection에는 Target, Minimize, Maximize 등으로 설정할 수 있는데,
Target으로 지정하게 되면 TargetValue를 기준으로 임곗값 관련 색상이 정해지게 된다.

마찬가지로 ChartType만 #Area로 설정해주고, 나머지는 똑같은 방식으로 정의해주면 된다.
'SAP > CAP' 카테고리의 다른 글
| [ CAP ] @Communication.Contact와 @UI.IsImageURL 사용해 UI 구성하기 (2) | 2023.05.15 |
|---|---|
| [ CAP ] objcect 페이지의 default 값 대입해 UI 비동기 갱신하기 (2) | 2023.05.08 |
| [ CAP ] 기본 entity 변경사항이 반영된 entity 데이터 값 보여주기 (7) | 2023.04.27 |
| [ CAP ] CDS와 SAPUI5를 이용한 파일 업로드 - .cds / .js (0) | 2023.04.20 |


